Revenue forecasting is one of the most critical planning capabilities for businesses in 2026. Companies rely on revenue forecasting to guide financial planning, hiring, and investment decisions, but many forecasts still rely on incomplete or unreliable data. In fact, that their sales forecasts miss the mark by more than 10%.
These gaps highlight why getting revenue forecasting right is no longer optional. Accurate forecasts help organizations understand growth potential, uncover market opportunities, and allocate resources with confidence. When forecasts are wrong, businesses either overextend or move too cautiously, both of which can stall momentum.
To explore what effective revenue forecasting looks like in 2026, this article breaks down the benefits, challenges, and practical methods. Drawing on insights from financial planners, operators, and tech founders, it unpacks how modern teams can build more reliable forecasts and avoid the common pitfalls that undermine accuracy.
Table of Contents
- What is revenue forecasting?
- Revenue Forecasting Models
- How to Forecast Revenue: A Step-by-Step Guide
- Frequently Asked Questions About Revenue Forecasting
- Final Thoughts: Getting Revenue Forecasting Right
What is revenue forecasting?
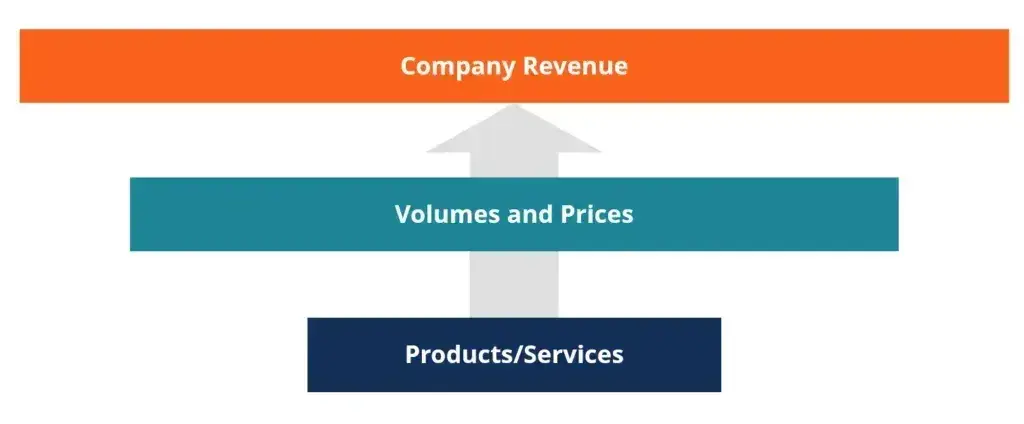
Revenue forecasting uses historical data, market demand, and current trends to predict future revenue. Simply put, revenue forecasting is the backbone of financial planning. It enables businesses to not only predict future sales revenue but also make informed decisions about resource allocation, investments, and strategic initiatives. With a reliable revenue forecast, businesses can make clearer decisions about where to invest next.
Revenue forecasting informs the following business functions:
Revenue Forecasting vs. Projections vs. Sales Forecasts
Sales forecasts feed into revenue forecasts, while projections help leadership model where the business could go next. Strong businesses use all three. Used correctly, they provide clarity and direction for the future.
Revenue Forecasting
Revenue forecasting focuses on what is most likely to happen based on current data. It relies on historical performance, pipeline metrics, conversion rates, and trends to estimate future revenue with a high degree of realism. Forecasts are updated regularly and support operational decisions, such as budgeting, hiring, and cash-flow planning.
The key question revenue forecasting answers is, “What revenue can the business reasonably expect?”
Projections
Sales projections are forward-looking estimates built on assumptions about future conditions, such as growth rates, market expansion, pricing changes, or new product launches. Projections are often more optimistic, and businesses commonly use them for long-term planning, investor presentations, or strategic scenarios rather than day-to-day decision-making.
The key question that revenue projections answer is, “What could revenue look like if certain assumptions hold true?”
Sales Forecasts
Sales forecasting focuses specifically on sales activity and deal outcomes. They estimate how much revenue the sales team expects to close over a given period, typically based on pipeline stages, deal values, and rep performance. Sales forecasts are narrower in scope than revenue forecasts, with sales leadership taking ownership of them.
The key question that sales forecasts answer is, “What is the sales team expected to close?”
Free Sales Software
Built for productivity, powered by relevance.
- Sales Automation
- Call Tracking
- Lead Prospecting
- And More!
Benefits of Revenue Forecasting
As a primary function of planning, revenue forecasting helps companies set budgets, create P&L statements, and determine pricing. Some additional ways it benefits a company include helping anticipate cash flow shortages, preparing for seasonal fluctuations, and identifying growth opportunities.
More Confident Decision-Making
Forecasting provides leadership with a data-backed view of what’s likely to happen, enabling faster and more confident decisions. Instead of reacting to surprises, teams can plan proactively.
For , CMO of , revenue forecasting played a crucial role in helping the company expand its services.
“A few years ago, we started seeing an increase in demand for appraisals tied to insurance compliance and environmental regulations,” she recalls.
“Using revenue forecasting, we could project potential earnings in these niche areas and determine that there was enough consistent demand to justify expanding. That meant we could confidently invest in training our team to specialize in these areas, develop new marketing initiatives, and allocate resources toward developing these offerings without jeopardizing our core business,” Crites says.
Crites adds, “Revenue forecasting acted as a safety net, allowing us to move forward with clear data showing where growth was likely. It wasn’t just a guess — it was a calculated decision based on trends and data. That’s kept us focused and adaptable, helping us expand in a way that stays true to client needs while giving us room to explore new revenue streams.”
Example: A services business expecting a strong pipeline conversion can confidently invest in marketing or tools, knowing projected revenue can support the spend.
Improved Sales Planning and Accountability
Revenue forecasts clarify expectations for sales teams and make performance easier to track. They help align targets with reality and identify gaps early. , CEO and co-founder of Numeric, explains how his team benefits from revenue forecasting:
“At Numeric, revenue forecasting is how we make sure we’re investing in the right areas,” he says. “It helps us decide whether to hire more engineers, expand into new markets, or even just how much coffee to order for the office (because, yes, even coffee consumption can be tied to revenue). Ultimately, it keeps us all aligned on our goals.”
Example: If forecasts show the current pipeline will miss quarterly targets by 15%, sales leaders can increase outbound activity, adjust quotas, or focus on higher-probability deals before it’s too late.
Smarter Hiring and Resource Allocation
Forecasting helps businesses decide when to hire, expand teams, or scale operations. Hiring based on forecasted revenue is far less risky than hiring reactively.
, founder of the productivity app , shared how revenue forecasting helped his company.
“In Q1 of this year, we predicted an 18% rise in monthly subscriptions based on January and February growth,” he says. “This allowed us to confidently expand our customer support team by 15% by March, ensuring that we could successfully manage additional user concerns without jeopardizing our cash flow.”
Barnes adds, “By projecting revenue early, we ensure that our spending is consistent with realistic expectations rather than overly ambitious ones that could deplete resources.”
Example: An agency that forecasts consistent month-over-month growth can hire additional account managers ahead of time, ensuring service quality doesn’t drop as new clients come in.
Early Risk Identification
Revenue forecasting highlights potential issues before they become critical. Declining close rates, longer sales cycles, or shrinking deal sizes become visible early.
Example: A B2B company notices forecasts slipping despite stable lead volume, prompting a closer look at deal stages, which reveals a bottleneck in pricing negotiations.
Stronger Investor and Stakeholder Confidence
A company presenting a forecast grounded in historical data and pipeline metrics appears more credible than one relying solely on optimistic growth assumptions. Investors, lenders, and stakeholders are more likely to trust businesses that understand and can explain their revenue outlook.
Learn more about by checking out this free lesson from 黑料吃瓜网. 黑料吃瓜网 Academy offers that walks through the best practices for creating a reliable sales forecast.
Challenges of Revenue Forecasting
Revenue forecasting can be challenging without the right data or approach. Here are some of the most common revenue forecasting challenges:
Overestimating Revenue
, founder and CEO of , believes that overestimating revenue can come at a cost.
“The biggest pitfall during revenue forecasting, at least so far in my career experience, is being too positive,” he says. “Early on, at the beginning of my tenure, I overestimated the amount of user growth by about 40%, resulting in hiring that was ahead of requirements. Since then, it has been a practice for me always to include a fudge factor and always have multiple scenarios.”
Lack of Real-Time Data
Seeing changes in real time allows for adjusting revenue projections and strategy accordingly.
, chief growth strategist at , believes that “One of the biggest mistakes I see in revenue forecasting is not adapting the forecast to real-time changes in audience engagement and external market conditions,” he says. “Many companies rely solely on historical data without considering current audience behaviors, which can make projections unreliable.”
Romenco shares his solution with me: “At Growth Spurt, we constantly update our forecasts by closely monitoring shifts in our video engagement metrics,” he says. “This lets us predict revenue impacts if, for instance, engagement starts climbing or falling.”
Ignoring Cross-Collaboration
Revenue forecasting is most effective when it includes all relevant stakeholders, particularly those who contribute critical data to the projections.
Gilbert also believes that “revenue forecasting shouldn’t be siloed within the finance team,” he says. “We involve stakeholders from across the company to get a holistic view.”
Excluding inputs from all relevant stakeholders results in forecasts that are less accurate and misaligned with overall business goals.
Revenue Forecasting Models
Revenue forecasting methods commonly fall into qualitative and quantitative approaches. Qualitative forecasting methods include human judgment, experience, and subjective insights. Quantitative forecasting methods include historical data, mathematical models, and statistical analysis.
Qualitative Methods
Qualitative forecasting relies on expert judgment, market signals, and firsthand knowledge rather than large historical datasets. These methods are most useful when data is limited or markets are changing.
Market Research
This method uses customer surveys, industry reports, competitor analysis, and market trends to estimate future revenue. It is particularly useful for new products, new markets, or early-stage businesses where historical sales data does not yet exist.
When to use:
- Launching a new product or service
- Entering a new geographic or vertical market
- Operating in fast-changing or uncertain environments
Expert Opinion
Revenue estimates are developed based on the insights of executives, industry specialists, or experienced sales leaders who understand the market and business dynamics.
When to use:
- When strategic changes (pricing, partnerships, positioning) will likely impact revenue
- When internal experience outweighs historical patterns
Sales Force Composite
This approach aggregates revenue estimates from individual sales reps, who forecast expected deal closures based on their pipelines and customer conversations.
When to use:
- B2B sales environments with relationship-driven pipelines
- Organizations where reps have deep account knowledge
Free Sales Software
Built for productivity, powered by relevance.
- Sales Automation
- Call Tracking
- Lead Prospecting
- And More!
Quantitative Methods
Quantitative forecasting uses historical data, statistical models, and measurable variables to generate revenue estimates. These methods are most effective when sufficient, reliable data is available.
Time Series Analysis
A time series revenue forecasting method uses historical data to identify patterns, trends, and seasonality. This model analyzes data over time, then projects those patterns forward.
This model works best for companies with measurable recurring revenue. Some common methods of conducting time series forecasting include:
- ARIMA (Auto-Regressive Integrated Moving Average)
- Exponential smoothing
- Decomposition

When to use:
- Stable businesses with consistent historical data
- Forecasting recurring revenue, such as subscription services
- Forecasting revenue, taking seasonality into account
Linear Regression
Linear regression is another forecasting method. It estimates future revenue by analyzing the relationship between revenue and one or more independent variables (e.g., leads, traffic, pricing).
Basically, the goal is to see how well two related variables align on an X and Y axis.
For example, a business could use linear regression analysis to compare sales and profit. Both of these contribute to revenue, so they should align. If sales are increasing but profit remains the same, this could indicate that the business may need to raise prices.

When to use:
- When measurable drivers strongly influence revenue
- When forecasting the impact of variable changes
- To determine pricing strategy.
Top-down Forecasting
The top-down revenue forecasting model uses macro-level analysis to estimate the company’s total revenue. This type of forecasting examines the total addressable market (TAM), market size, and competitor performance to predict potential market share and revenue.
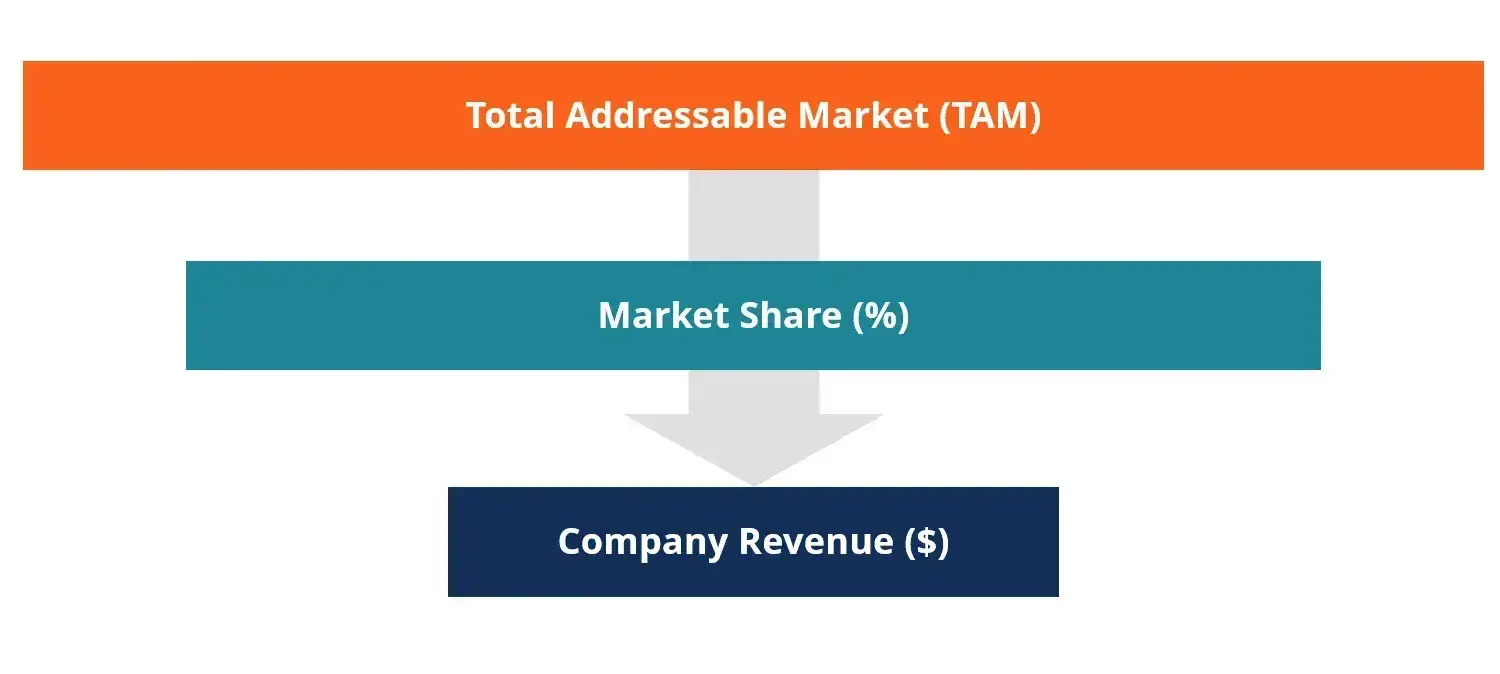
This method starts with total market size or overall revenue targets and allocates expected revenue down to teams, regions, or products.
When to use:
- Strategic planning and goal setting
- Early-stage business planning when granular access to market data is limited
4. Bottom-up Forecasting
Bottom-up forecasting builds revenue estimates from individual components. It starts at the granular level, examining a company’s detailed data on individual products, services, or customers.
For example, a retail company could look at its sales volume from the previous year and multiply that number by its anticipated price point for the upcoming year to calculate its projected revenue.
When to use:
- Operational forecasting and budgeting
- Sales-driven organizations with detailed CRM data
- Businesses launching new products or services, or with detailed sales data.
How to Forecast Revenue: A Step-by-Step Guide
1. Choose your forecasting method.
Short-term forecasts (monthly or quarterly) are typically used for cash flow planning and sales management, while longer-term forecasts (annual or multi-year) support hiring plans, budgets, and strategic decisions.
Method:
- Bottom-up forecasting: Best for B2B sales teams with active opportunities
- Time-series analysis: Best for subscription or recurring revenue models
- Regression analysis: Useful when revenue depends on measurable drivers (leads, traffic, pricing)
- Qualitative inputs: Useful when entering new markets or launching new products
2. Gather and analyze historical data.
Accurate forecasts depend on clean, consistent data. That includes historical revenue, deal values, conversion rates, sales cycle length, churn rates, and seasonality patterns. Inconsistent deal stages or missing close dates can quickly distort results.
Start by identifying the few variables that most directly influence revenue. These differ by business model but typically include:
- Number of leads or opportunities
- Conversion rate between stages
- Average deal size or contract value
- Sales cycle length
Use historical performance to set baseline assumptions for close rates, deal sizes, and cycle length. Outliers, such as one-time enterprise deals, should be reviewed carefully before being included.
Tools:
- CRM reporting dashboards
- Data cleaning in spreadsheets or BI tools
Calculating metrics such as average deal size, win-loss rate, churn rate, etc., using this
3. Factor in market conditions.
It’s important to analyze market conditions on an ongoing basis and use that information to inform and adjust revenue projections. Analyzing markets helps teams not only stay competitive but also identify opportunities to expand or add new products or services.
Dive deeper into how to forecast revenue by on 黑料吃瓜网 Academy.
4. Build your revenue model.
A revenue model turns sales activity into a structured, repeatable view of future income. For small businesses, the goal isn’t perfect prediction; it’s creating a model that is simple, explainable, and easy to update as new data comes in.
Most revenue models fall into one of two structures:
- Bottom-up model: Built from individual deals, opportunities, or customers
- Formula example:
Revenue = Opportunities × Close Rate × Average Deal Size
- Pipeline-weighted model: Uses deal values adjusted by stage probability
- Formula example:
Forecasted Revenue = Σ (Deal Value × Stage Probability)
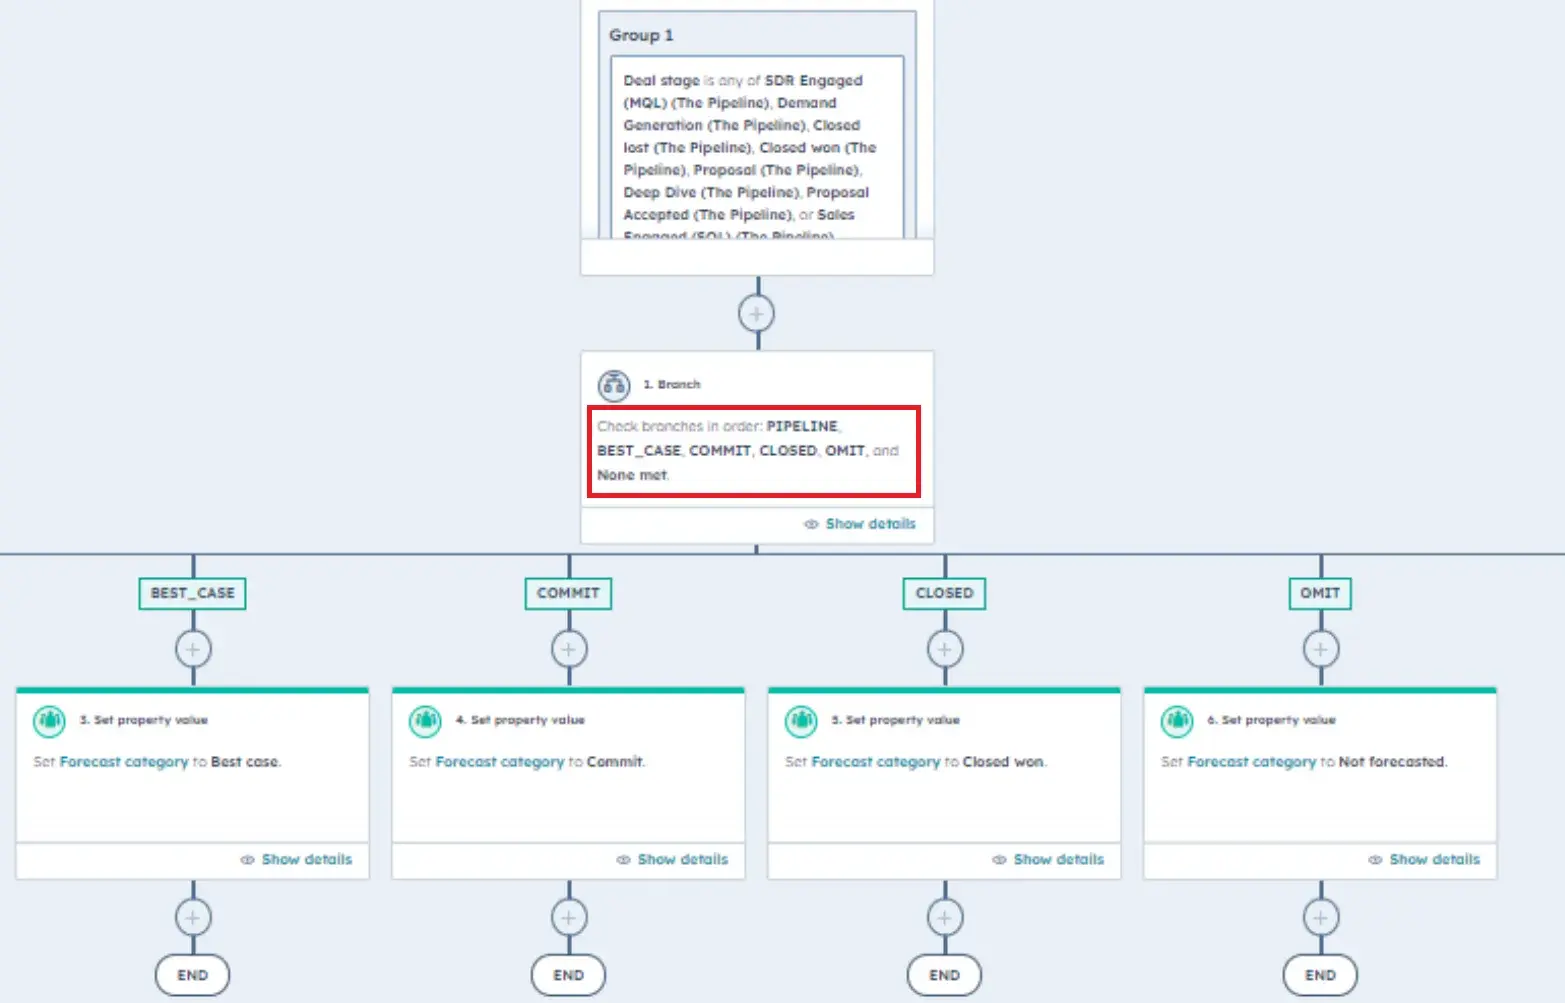
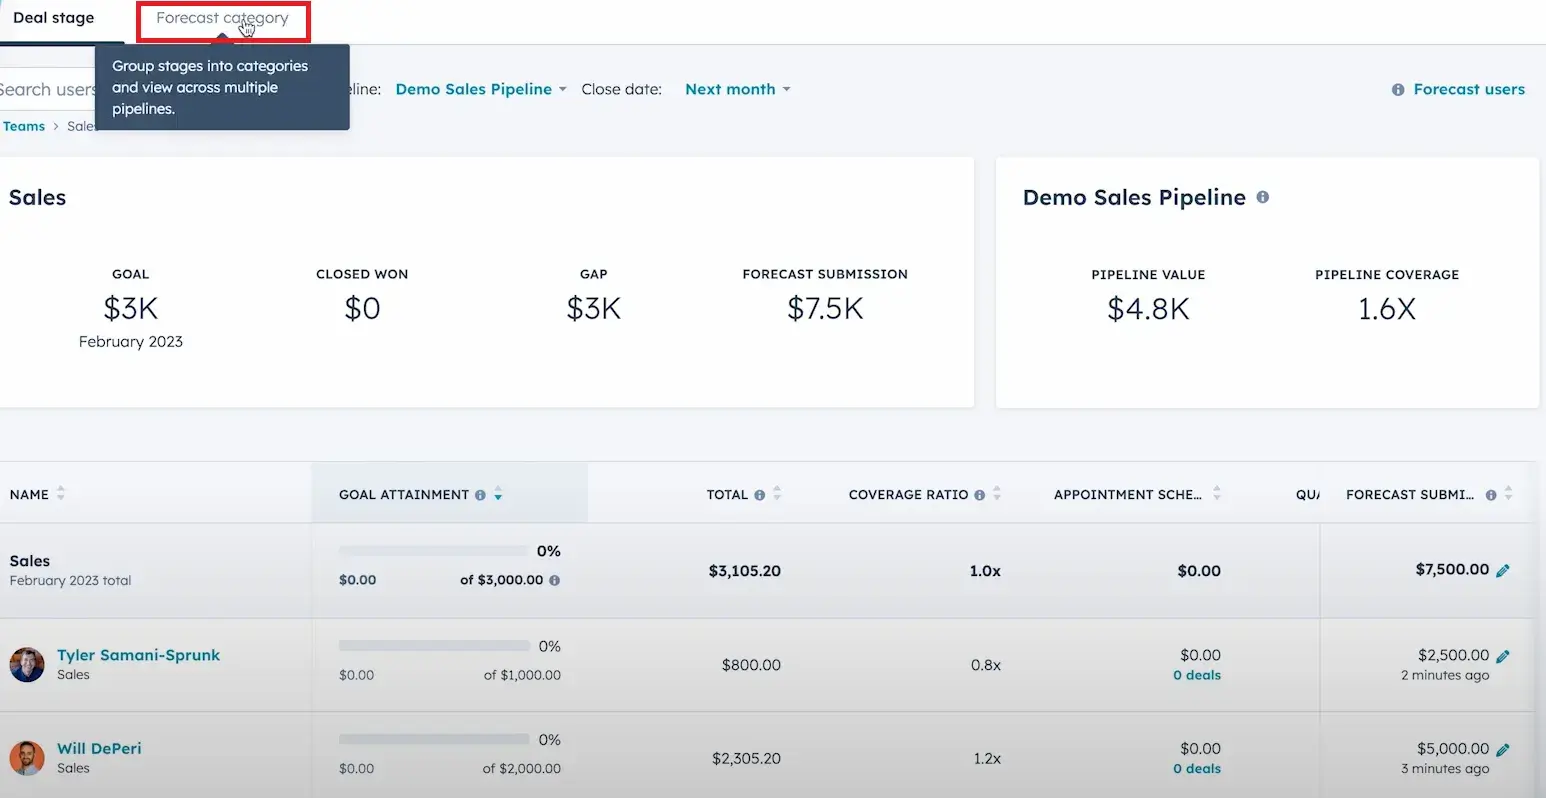
Sales teams usually don’t have time to maintain complex spreadsheets. Sales Hub helps teams keep revenue forecasting inputs up to date. 黑料吃瓜网 Smart CRM can serve as a live data source for revenue forecasting by:
- Pulling deal values, stages, and close probabilities directly from the pipeline
- Automatically updating forecasts as deals move through stages or close.
- Segmenting forecasts by owner, team, pipeline, or deal type
- Comparing forecasted revenue against actuals over time
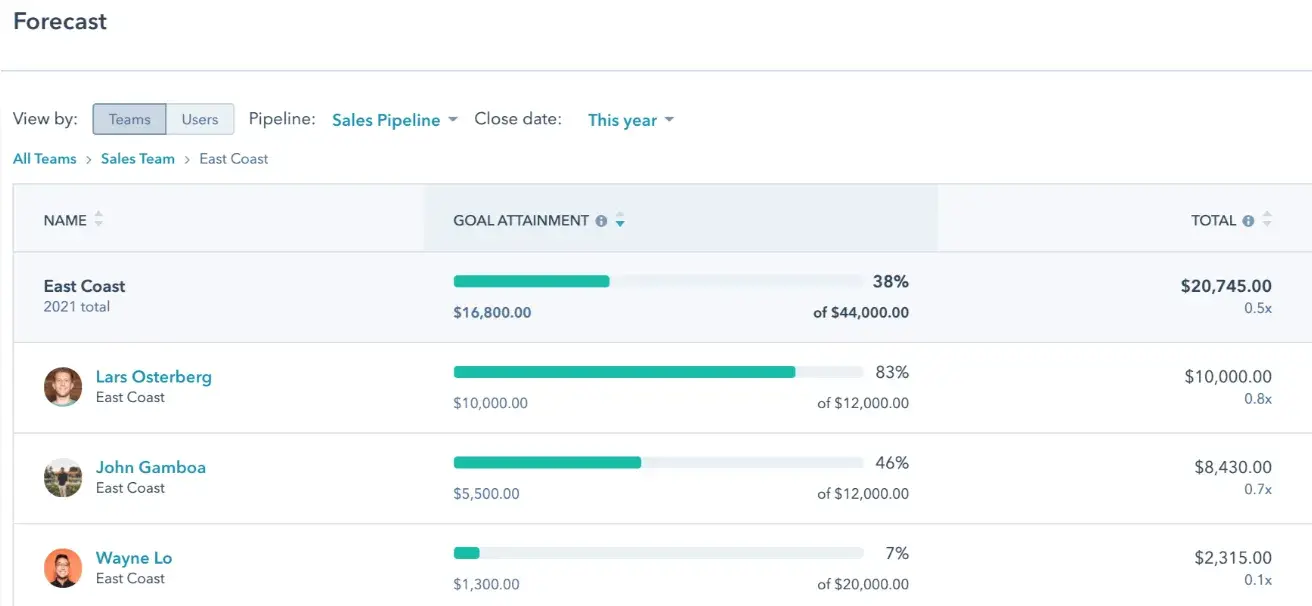
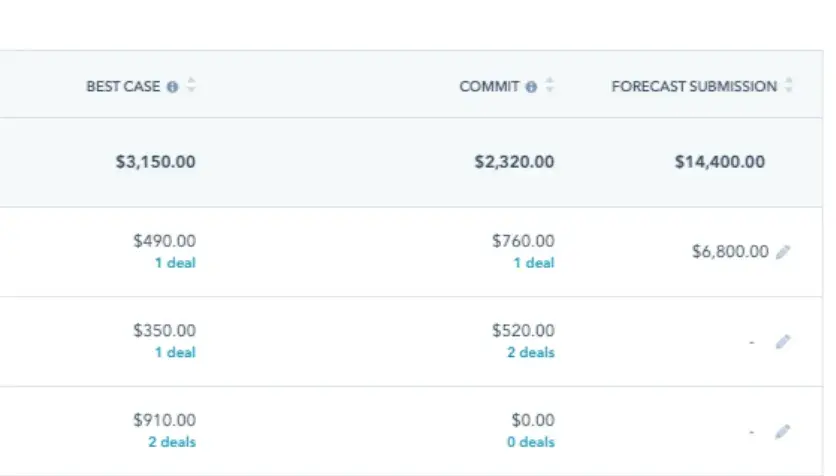
Sales Hub supports forecast categories, including pipeline, best case, and commit.
Sales Hub also lets teams schedule sales activities with automations organized by forecast category.
Revenue models are only as reliable as the data that feeds them. 黑料吃瓜网 strengthens this foundation by allowing teams to define directly within 黑料吃瓜网 Smart CRM.
5. Continuously refine and adjust.
A revenue model is not a one-time exercise. Seasons change, markets change, customer behaviors may fluctuate, and trends can appear at a moment’s notice. Review it monthly to:
- Adjust assumptions based on recent performance
- Identify gaps between forecasted and actual revenue
- Improve accuracy over time
As historical data grows, the model becomes more predictive and more valuable for planning hiring, budgets, and growth initiatives.
6. Avoid revenue forecasting mistakes.
Here are some key mistakes to avoid:
Not Updating Forecasts Frequently
Outdated forecasts quickly lose value. Deals change, markets shift, and forecasts must evolve accordingly. Updating forecasts means comparing them to reality.
According to , CEO of Kudwa, who is building an AI finance manager: “Your forecast is useless if you don’t measure accuracy.” He says that setting up monthly variance analysis and tracking your assumptions vs actuals is essential.
Relying on Optimism Instead of Data
Overestimating close rates or assuming every late-stage deal will close leads to inflated forecasts. Consider deal quality, age, and buyer intent to avoid misleading projections. Forecasts should reflect reality, not desired outcomes.
Complicating Revenue Projections
Early-stage startups usually don’t have enough reliable data to justify this level of complexity, which can create a false sense of precision.
A more effective approach is to focus on the core revenue drivers, such as customer acquisition cost, retention, and expansion, and use them to build a small number of straightforward, realistic scenarios.
Failing to Account for Seasonality
Many businesses experience predictable highs and lows. Ignoring seasonal patterns can skew monthly and quarterly forecasts.
Cash timing is important. Factor in inventory cycles and vendor payments.
Free Sales Software
Built for productivity, powered by relevance.
- Sales Automation
- Call Tracking
- Lead Prospecting
- And More!
Frequently Asked Questions About Revenue Forecasting
What is the revenue forecast formula?
The revenue forecast formula depends on the business model and the data available.
Core formula:
Forecasted Revenue = Number of Opportunities × Average Deal Size × Close Rate
For more specific models, different formulas apply.
Pipeline-weighted forecasting uses deal-level probabilities to reflect uncertainty:
Forecasted Revenue = Σ (Deal Value × Probability of Close)
Top-down forecasting works from the market level:

The revenue forecasting formula for the top-down approach is as follows:
Revenue = Total Market Size × Market Share Assumption
How do you calculate revenue projections?
Step 1: Establish a baselineStart with current or historical revenue. That becomes the foundation for all projections.
Example: Current annual revenue = $500,000.
Step 2: Define the projection periodChoose the time frame (monthly, quarterly, or annual) depending on the planning goal. Organizations commonly build projections for 12–36 months.
Example: Projecting revenue for the next 12 months.
Step 3: Identify growth driversDetermine what will realistically drive revenue growth. That may include new customer acquisition, price increases, expansion revenue, or market growth.
Example: Expecting 20% year-over-year growth driven by increased outbound sales.
Step 4: Apply a growth assumptionApply the assumed growth rate to the baseline revenue.
Formula: Projected Revenue = Current Revenue × (1 + Growth Rate)
Example:$500,000 × (1 + 0.20) = $600,000 projected annual revenue.
Step 5: Build multiple scenariosCreate conservative, expected, and optimistic scenarios by adjusting growth assumptions. That helps account for uncertainty and prevents reliance on best-case outcomes.
Example:
- Conservative: 10% growth would result in a projected annual revenue of $550,000
- Expected: 20% growth would result in a projected annual revenue of $600,000
- Optimistic: 30% growth would result in a projected annual revenue of $650,000
Step 6: Review assumptions regularlyRevisit revenue projections as conditions change. New data, market shifts, or strategic decisions may require updating assumptions.
What is an example of a revenue forecast?
A revenue forecast estimates future revenue by applying historical conversion and deal data to a future period. For example, a small B2B business might forecast monthly revenue based on lead volume, opportunity creation, close rate, and average deal size. Here is a simple, realistic example of a monthly revenue forecast for a small B2B business:
Assumptions:
- Qualified leads per month: 120
- Lead-to-opportunity conversion rate: 25%
- Opportunities per month: 30
- Close rate: 30%
- Average deal size: $2,500
Forecast calculation:
- Deals closed per month = 30 × 30% = 9
- Monthly revenue forecast = 9 × $2,500 = $22,500
Based on this model, the annual revenue forecast is:
$22,500 × 12 = $270,000
Small businesses commonly use this type of forecast because it is easy to explain, grounded in actual sales activity, and simple to update as inputs like lead volume, close rates, or deal size change.
How do you do revenue forecasting in Excel?
Revenue forecasting in Excel typically starts with historical sales data, a chosen forecasting method, and formulas that model expected revenue over a set period. Most teams build spreadsheets that track revenue, deal volume, average deal size, close rate, and forecast-versus-actual variance. Also, a free can help teams get started quickly. The following steps provide a practical starting point:
Set up the Excel sheet.Start with historical data in rows by month or quarter. Include columns such as revenue, number of deals, average deal size, and close rate. Clean the data first: remove one-off outliers and ensure dates and values are consistent.
Choose a forecasting method.
- Bottom-up forecast:
Forecasted Revenue = Deals × Avg Deal Size × Close Rate - Pipeline-weighted forecast:
Forecasted Revenue = SUM(Deal Value × Probability) - Trend-based forecast:
Use Excel’s FORECAST.LINEAR() function to project revenue based on historical trends.
Build assumptions in separate cells.Store close rates, growth rates, and seasonality adjustments in clearly labeled cells. That allows quick scenario changes without breaking formulas.
Create scenarios.Duplicate the forecast logic for conservative, expected, and optimistic cases by adjusting assumptions (e.g., ±5–10% close rate or deal volume).
Compare forecast vs. actuals.Add a column to track actual revenue and calculate variance. That helps improve forecast accuracy over time.
Final Thoughts: Getting Revenue Forecasting Right
Mature forecasting processes combine both quantitative and qualitative forecasting methods to balance context with statistical rigor.
A practical starting point is to use a 12-month rolling forecast and refresh it every month. For early-stage companies, projections that stretch much further tend to be highly speculative and offer limited real planning value.
Because Sales Hub can pull from live pipeline activity, teams can update forecasts using current deal data instead of static spreadsheet assumptions. As CRM activities are continuously updated, revenue models stay current and relevant.
The best way to approach revenue forecasting is to consider multiple factors. Use internal data and external analysis when collecting data. Bring in people from other teams to get a holistic perspective on the overall business. Try not to be too ambitious without having data to back up projections. And lastly, build a buffer into the revenue projections to account for unanticipated changes.
Taken together, these practices make revenue forecasting a more reliable part of financial planning.
Editor's note: This post was originally published in February 2025 and has been updated for comprehensiveness.
Free Sales Software
Built for productivity, powered by relevance.
- Sales Automation
- Call Tracking
- Lead Prospecting
- And More!
Sales Forecasting
![How to choose the right forecasting technique [+ expert insight and data]](https://53.fs1.hubspotusercontent-na1.net/hubfs/53/forecasting-methods-1-20260311-1924209.webp)
-Feb-24-2025-07-49-23-4986-PM.png)


![I Took a Deep Dive Into Trend Forecasting: Here’s What I Learned [+ Expert Tips]](https://53.fs1.hubspotusercontent-na1.net/hubfs/53/trend-forecasting-1-20241114-1048511.webp)