Customer acquisition analytics tracks the cost, speed, and quality of every new customer a business brings. However, most marketing teams still struggle to connect those numbers to actual revenue outcomes. According to SimplicityDX, customer acquisition costs have over the past eight years, with the sharpest increases in digital channels, where competition and privacy regulations are tightening.
The problem compounds when disconnected tools scatter data across multiple sources. CRM records sit in one system, ad performance in another, and website behavior in a third. Marketing leaders end up making budget decisions based on partial information, overspending on channels that look busy but don’t convert, while starving the ones that drive revenue.
This post covers the metrics that matter, how to measure customer acquisition performance, and how to optimize the customer acquisition funnel end-to-end.
Table of Contents
- What is customer acquisition analytics?
- Why is data analytics important for customer acquisition?
- What makes great customer acquisition data for analysis?
- How to Analyze and Optimize the Customer Acquisition Funnel
- 10 Customer Acquisition Metrics to Analyze
- How do I gather customer acquisition data and metrics?
- Bring Acquisition Metrics and Revenue Into One View
- Frequently Asked Questions About Customer Acquisition Analytics
What is customer acquisition analytics?
Customer acquisition analytics measures the effectiveness of marketing and sales efforts to gain new customers. It includes the data, tools, and frameworks that reveal how prospects discover a brand, what convinces them to convert, and how much each conversion costs relative to the revenue it generates.
Where general marketing analytics might track impressions or engagement, customer acquisition analytics focuses specifically on the path from stranger to paying customer, and whether that path is profitable.
The distinction matters because related disciplines answer different questions. Marketing analytics measures campaign performance broadly (reach, clicks, engagement). Sales analytics tracks pipeline velocity and close rates. Customer acquisition analytics sits at the intersection: it connects upstream marketing activity to downstream revenue by following a lead from first touch through purchase.
.webp)
Free Customer Journey Template
Outline your company's customer journey and experience with these 7 free templates.
- Buyer's Journey Template
- Future State Template
- Day-in-the-Life Template
- And more!
Download Free
All fields are required.
Form not available
You're all set!
Click this link to access this resource at any time.
The Customer Acquisition Funnel
Most acquisition analytics work maps to a funnel with four core stages.
- Awareness marks the first encounter where a potential customer finds the brand through organic search, paid ads, social content, or a referral.
- Interest follows when that visitor engages more deeply, consuming content, comparing options, or signing up for free resources.
- Consideration is the evaluation phase. Prospects weigh the product against alternatives, request demos, or begin trials.
- Conversion is the moment a prospect becomes a paying customer.
Each stage generates its own set of metrics. Customer acquisition analytics tracks movement between stages, identifies where prospects drop off, and quantifies the cost and time investment required at each step.
黑料吃瓜网’s customer acquisition funnel tools help teams visualize these stages and pinpoint exactly where leads stall or leak out of the pipeline.
Four Levels of Analytics Maturity
Since not every organization approaches customer acquisition analytics the same way, analytics maturity typically falls into four levels.
- Descriptive analytics answers “what happened” by providing basic reporting on traffic, leads, and conversions over a time period.
- Diagnostic analytics answers “why it happened” by segmenting data by channel, campaign, or audience to identify what drove results up or down.
- Predictive analytics answers “what will happen” by using historical patterns and AI to forecast future acquisition costs, conversion rates, and revenue.
- Prescriptive analytics answers “what should we do” by recommending specific actions based on data models, such as reallocating budget from underperforming channels to high-converting ones.
Most marketing teams operate at the descriptive or diagnostic level. Organizations that gain a measurable edge are those that push into predictive and prescriptive territory, using tools that automate analysis rather than relying on manual spreadsheet work.
supports this progression. automatically identifies anomalies and forecasts shifts, moving teams from “what happened last quarter” to “what’s likely to happen next quarter and what to do about it.”
Why is data analytics important for customer acquisition?
Customer acquisition analytics transforms marketing from guesswork into a measurable, repeatable system. Marketing teams that track user acquisition metrics make faster budget decisions, reduce wasted spend, and concentrate resources on the channels and tactics that produce actual revenue.
Without customer acquisition analytics, every campaign is a bet. With it, every campaign is a test that generates usable intelligence. The difference between operating with and without acquisition analytics is stark:
|
Scenario |
Without Analytics |
With Analytics |
|
Budget allocation |
Spread evenly across channels based on gut feel |
Concentrated on channels with proven CAC-to-CLV ratios |
|
Channel performance |
Measured by clicks and impressions |
Measured by downstream revenue and customer quality |
|
Lead follow-up |
Every lead gets the same treatment |
Leads scored and routed by conversion probability |
|
Campaign optimization |
Adjusted at the end of the quarter |
Adjusted in real time based on live conversion data |
|
Forecasting |
Based on last year's numbers and assumptions |
Based on predictive models using behavioral cohort data |
|
Churn response |
Noticed after revenue drops |
Flagged early by declining engagement patterns |
Three capabilities make the difference:
1. Pinpoint the right audience.
Customer acquisition analytics reveals who converts, not just who clicks. Demographic data, behavioral signals, and purchase patterns help marketing teams identify the segments most likely to buy and the channels where those segments spend time.
Consider an online sneaker retailer whose acquisition data shows that women between 18 and 25 generate the highest purchase rates and the lowest return rates. Armed with that insight, the marketing team can tailor ad creative, channel selection, and messaging to that specific segment, rather than spreading the budget evenly across lower-converting audiences.
2. Eliminate wasted spend.
Customer acquisition analytics identifies the gap between activity and results. A channel might generate impressive click-through rates while producing almost no paying customers. Another channel might look quiet on the surface but deliver the highest-value conversions at the lowest cost.
For example, a SaaS company might discover that Facebook ads drive high traffic but a 0.5% purchase conversion rate, while email nurture sequences convert at 5% with a fraction of the spend. Without acquisition analytics connecting clicks to revenue, that SaaS company keeps funding the wrong channel.
tracks these connections automatically, linking every touchpoint to downstream revenue so growth leaders can see which investments actually pay off. For teams looking to reduce customer acquisition cost, channel-level visibility is the starting point.
3. Predict what’s next.
Historical acquisition data contains forward-looking intelligence. Seasonal purchase patterns, campaign response curves, and cohort behavior all point to what will happen under similar conditions. Predictive customer acquisition analytics lets marketing teams pre-allocate budget before a seasonal spike, prepare inventory before demand surges, and identify early warning signs of declining channel performance.
A custom clothing brand that identifies a recurring fall spike in sweater sales can front-load ad spend and customize designs for the upcoming season. This lets them forecast ROI with confidence, rather than reacting after the trend peaks.
Teams exploring AI for customer acquisition are increasingly using these predictive signals to automate budget shifts before performance drops become visible in monthly reports.
Real-World Evidence
Case study: Boosting acquisition for a California bank. Quantzig, a customer analytics firm, helped a California-based bank apply segmentation and customer profiling to its acquisition strategy. Customer acquisition jumped , driven by long-term customers who also fuel referral-based growth.

What makes great customer acquisition data for analysis?
Great customer acquisition analytics depends on data that’s segmented, source-attributed, integrated across tools, and enriched with predictive signals. The data must link individual customer actions to business outcomes such as revenue, retention, and lifetime value to be useful for acquisition decisions. Four pillars define high-quality acquisition data.
1. Customer Segmentation
Customer segmentation splits acquisition data into groups based on who the buyers are, what they’ve done, and what they’ve bought. Segmented data reveals which audience groups convert at the highest rates and lowest costs, patterns that blended averages hide. For B2B teams, segmentation also accounts for company size, industry, and revenue stage.
黑料吃瓜网’s team, for example, analyzes how free users who eventually upgrade behave compared to those who don’t. These behavioral segments inform onboarding flows, email nurture content, and ad targeting, guiding specific user groups along the path to becoming paying customers.
At a macro level, segmented acquisition data also helps marketing teams understand how most users behave. This shapes top-of-funnel campaigns that keep 黑料吃瓜网 visible to anyone searching for marketing and sales solutions.
let teams create dynamic segments based on contact properties, behaviors, and lifecycle stages. Then, the tools target each segment with tailored campaigns that match where they are in the customer acquisition funnel.
2. Lead Source Tracking
Lead source tracking attributes every new customer to the channel that brought them in: organic search, paid ads, social media, email campaigns, referrals, or influencer partnerships. Without source tracking, marketing teams can’t calculate channel-level customer acquisition cost (CAC) or identify which investments produce the best returns.
Gymshark provides a clear example. Every influencer partner receives a unique discount code. When customers use the code MARNIEH at checkout, the Gymshark team knows that this specific influencer drove those sales.

If volume justifies it, they increase the partnership investment. If it doesn’t, they reallocate. Source tracking turns acquisition spend from an art into an accountable system.
3. Integration and Automation
Fragmented tools produce fragmented customer acquisition analytics. When CRM records, email engagement, ad performance, and website behavior live in separate systems, marketing teams spend more time reconciling spreadsheets than acting on insights.
combines customer relationship management, email marketing, ad tracking, and social media tools into a single platform. When a company runs a social media campaign, 黑料吃瓜网 captures new leads, automatically updates CRM records, and attributes those leads to the originating channel without requiring manual data entry.

Marketing teams can also use to capture leads from gated content, then let automated workflows nurture those contacts through the funnel while logging every interaction. Teams building content to drive customer acquisition can use to create assets like blog posts, landing pages, and gated resources. to brainstorm topics that align with what their target audience is actively searching for.
黑料吃瓜网 also offers free versions of Marketing Hub and free tools like the blog topic generator, so teams can start building their customer acquisition analytics practice without a significant upfront investment.
4. Predictive Analysis and AI Insights
Predictive analytics moves customer acquisition from reactive reporting to forward-looking decision-making. Machine learning models analyze cart behavior, browsing patterns, and engagement signals to forecast which prospects are most likely to convert and what message will move them.
Amazon’s approach illustrates the principle at scale. AI analyzes cart abandonment data and user purchase history to send personalized follow-up emails that nudge users toward completing their purchase.
The result: Amazon listings convert at . Prime members convert at rates exceeding 74%. Predictive acquisition analytics gives marketing teams a head start on what’s coming next.

The practical application for most marketing teams starts with lead scoring. uses AI to analyze which contact properties and behaviors correlate with closed deals, then automatically ranks incoming leads by conversion likelihood.
Marketing teams can route high-probability leads directly to sales, while funneling lower-score contacts into nurture sequences. The result: less wasted sales effort and a shorter path to revenue for the leads most likely to convert.
Free Customer Journey Template
Outline your company's customer journey and experience with these 7 free templates.
- Buyer's Journey Template
- Future State Template
- Day-in-the-Life Template
- And more!
Download Free
All fields are required.
Form not available
You're all set!
Click this link to access this resource at any time.
How to Analyze and Optimize the Customer Acquisition Funnel
Customer acquisition funnel optimization identifies where prospects drop off between first touch and purchase, then fixes those leaks systematically. Customer acquisition analytics provides the data to diagnose each stage independently and improve conversion rates where the biggest gaps exist, rather than increasing top-of-funnel spend to compensate for mid-funnel losses. The following steps move from foundation to optimization:
Step 1: Map the full funnel with real data.
Before optimizing anything, marketing teams need a clear picture of how prospects actually move through the funnel, not how the team assumes they move. Pull traffic data, lead capture rates, MQL-to-SQL conversion rates, and close rates for a defined period (90 days minimum for statistical relevance).
What this looks like in practice: A B2B SaaS team pulls 90 days of data and discovers 12,000 monthly visitors, a 3.2% visitor-to-lead rate, a 28% MQL-to-SQL rate, and a 19% SQL-to-customer rate. The biggest drop in visitor-to-lead percentage immediately reveals where the largest opportunity lies.
Improvement tip: Use to visualize the full funnel in one view. The funnel report shows each stage side-by-side with conversion percentages and time between stages, so the team can identify the largest drop-off without manually assembling a spreadsheet.
Step 2: Audit traffic quality by channel.
Not all traffic is equal. Consider that a channel that sends 50,000 monthly visitors with a 0.3% conversion rate produces fewer customers than one sending 5,000 visitors at 4%. Marketing teams should segment traffic by source and calculate channel-level conversion rates and CAC.
What this looks like in practice: A DTC brand running paid social, organic search, and email campaigns discovers that organic search drives 30% of traffic but 55% of revenue, while paid social drives 45% of traffic but only 12% of revenue. The channel that looks busiest is the one bleeding budget.
Improvement tip: Cut or reduce spending on channels where CAC exceeds the customer’s projected lifetime value. Between 2023 and 2025, average CAC jumped , according to Phoenix Strategy Group, making channel-level efficiency analysis more important than ever.
Step 3: Optimize lead capture mechanisms.
The transition from visitor to lead is where most funnels leak. Landing pages with unclear value propositions, forms that ask for too much information too soon, and CTAs buried below the fold all suppress conversion.
What this looks like in practice: A B2B software company tests two versions of its demo request form, one with 8 fields (name, email, company, title, phone, revenue, team size, use case) and one with 3 (name, email, company). The shorter form lifts visitor-to-lead conversion from 2.1% to 4.7%. The missing data gets collected later through progressive profiling over the next two email interactions.
Improvement tip: Test lead capture forms with fewer fields. support progressive profiling, collecting information gradually over multiple interactions rather than front-loading a 10-field form on the first visit. Pair forms with landing pages so the capture-to-nurture handoff happens in one system.
Step 4: Score and segment leads.
Not every lead deserves the same follow-up. Lead scoring assigns point values based on behaviors (page visits, email opens, content downloads) and demographic fit, so sales teams focus on the prospects most likely to convert.
What this looks like in practice: A marketing team assigns +10 points for visiting the pricing page, +5 for opening a nurture email, and +20 for requesting a case study. A lead who hits 50 points gets routed to sales within 24 hours. A lead sitting at 15 stays in the nurture sequence. Before scoring, reps spent equal time on both. Afterward, close rates on sales-accepted leads jumped 22% because reps were working only with contacts who had demonstrated buying intent.
Improvement tip: automates this process, ranking leads based on engagement data already captured in the CRM. Marketing teams can then create and serve different nurture sequences to high-score versus low-score leads, rather than blasting the same email to everyone.
Step 5: Fix the nurture sequence.
Leads that aren’t sales-ready need education, not a pitch. Content mapping assigns the right asset to each funnel stage: awareness content for new leads, comparison content for consideration-stage leads, and case studies or demos for decision-stage leads.
What this looks like in practice: A SaaS company maps its nurture sequence and finds that leads who receive a comparison guide followed by a case study convert to demo requests at 12%, while leads who receive three product-feature emails in a row convert at 3%. The content order matters more than the content volume, and the sequence that mirrors the buyer’s decision process outperforms the one that mirrors the marketing team’s product priorities.
Improvement tip: automates email nurture workflows triggered by lead behavior. When a lead downloads a comparison guide, the workflow can automatically serve a case study three days later, then a demo invitation a week after that. The sequence adapts to what the lead actually does, not a fixed calendar.
Step 6: Reduce friction in the conversion step.
The final conversion step — checkout, contract signature, or onboarding — is where small friction points cause disproportionate drop-off. Complicated forms, surprise fees, slow load times, and missing trust signals all push ready buyers away.
What this looks like in practice: An eCommerce brand analyzes its checkout flow and discovers that 34% of cart abandoners drop off at the shipping cost reveal on page 3. Moving shipping estimates to the product page before add-to-cart cuts abandonment by 19% in the first month. The product, pricing, and value hadn’t changed. The only thing that changed was the buyer’s view of the full cost.
Improvement tip: Analyze the conversion step in isolation. Baymard Institute’s research shows that the average large eCommerce site can gain a through better checkout design alone, translating to $260 billion in recoverable lost orders across the U.S. and EU markets.
Step 7: Measure, attribute, and iterate.
After implementing changes, customer acquisition analytics should measure the impact at each funnel stage — not just overall conversion. Attribution modeling tracks which channels and touchpoints contribute to customer acquisition, giving credit where it’s actually due rather than defaulting to last-click.
What this looks like in practice: A marketing team switches from last-click attribution to a U-shaped model and discovers that the company blog previously credited with almost no conversions initiates 35% of customer journeys. That insight shifts budget from bottom-funnel retargeting toward content production, lowering overall CAC by 18% within two quarters.
Improvement tip: Use to link each customer interaction to revenue, track conversion rates across funnel stages, and measure time between steps. Multi-touch attribution models show the full picture of what’s working and what isn’t.
Pro tip: 黑料吃瓜网’s attribution reporting supports first-touch, last-touch, linear, and U-shaped attribution models so marketing teams can compare how different channels look under different attribution lenses. That prevents over-investing in channels that only appear at the end of the journey while ignoring those that started the relationship.
10 Customer Acquisition Metrics to Analyze
Choosing the right customer acquisition analytics metrics depends on where the funnel needs attention. Top-of-funnel problems (low traffic, poor awareness) call for reach and engagement metrics. Mid-funnel problems (high traffic but few leads) call for conversion and cost metrics. Bottom-of-funnel problems (leads that don’t close) call for velocity and value metrics.
User acquisition metrics — installs, sign-ups, and in-app conversions — apply the same logic to mobile and digital products. The table below summarizes all 10 metrics covered in this section with their formulas and primary use cases:
|
Metric |
Formula |
Best For |
|
Customer Acquisition Cost (CAC) |
Total marketing + sales costs ÷ New customers |
Budget allocation, channel efficiency |
|
Cost Per Acquisition (CPA) |
Campaign cost ÷ Conversions from that campaign |
Campaign-level performance |
|
Conversion Rate |
Conversions ÷ Total visitors × 100 |
Funnel health, landing page performance |
|
Customer Lifetime Value (CLV) |
Avg. purchase value × Avg. frequency × Customer lifespan |
Long-term profitability, CAC benchmarking |
|
Click-Through Rate (CTR) |
Clicks ÷ Impressions × 100 |
Ad and content relevance |
|
Churn Rate |
Lost customers ÷ Total customers × 100 |
Retention, early warning system |
|
Return on Investment (ROI) |
Net profit ÷ Marketing costs × 100 |
Overall profitability |
|
Return on Ad Spend (ROAS) |
Conversion revenue ÷ Advertising spend |
Campaign-level ad efficiency |
|
Average Order Value (AOV) |
Total revenue ÷ Number of orders |
Cross-sell/upsell opportunities |
|
Cart Abandonment Rate |
Abandoned carts ÷ Carts created × 100 |
Checkout optimization |
1. Customer Acquisition Cost (CAC)
Customer acquisition cost (CAC) measures the average expense a company incurs to acquire one new customer. CAC includes all marketing and sales costs: ad spend, team salaries, software, and content production, divided by the number of new customers gained during the same period.
CAC = Total marketing + sales costs ÷ Total customers acquired

CAC varies significantly by industry. B2B SaaS companies average $702 per customer, while eCommerce businesses average closer to $70, according to . Fintech companies face the steepest costs, averaging $1,450 per customer due to complex sales cycles and regulatory requirements.
The metric matters because it directly reveals whether a business’s growth is sustainable. Customer acquisition analytics starts with CAC. For instance, a $10,000 marketing investment produces 100 customers, yielding a $100 CAC, but that number only matters when compared to what those customers are worth over time. The industry benchmark for a healthy LTV:CAC ratio is 3:1, meaning each customer should generate at least 3X the revenue it costs to acquire them.
Try to calculate CAC alongside other key metrics. Growth leaders can input their own numbers and benchmark results against industry standards.
Pro tip: 黑料吃瓜网’s advanced marketing reporting connects each customer interaction to revenue, letting marketing teams see not just overall CAC but CAC broken down by channel, campaign, and content asset. This granularity shows exactly which investments are pulling their weight and which are inflating acquisition costs.
CAC vs. CPA: What’s the difference?
Marketing teams often conflate CAC and CPA, but they measure different things. CAC (Customer Acquisition Cost) is the sum of all sales and marketing expenses for a period, divided by the total number of new customers.
It’s a company-level metric. CPA (Cost Per Acquisition) measures the cost of a single campaign or channel to drive a specific conversion, such as a purchase, sign-up, or form submission, not necessarily a paying customer.
A company’s CPA for a Facebook ad campaign might be $25 per lead, but the full CAC – including the sales team that closes those leads, the nurture emails, and the software costs – might be $200 per paying customer. Both metrics are valuable, but they answer different questions. CPA measures campaign efficiency. CAC measures business sustainability.
2. Conversion Rate
Conversion rate reports the percentage of visitors who complete a desired action. In customer acquisition analytics, conversion rate applies at every funnel stage: from landing page visits to form submissions, from form submissions to MQLs, from MQLs to SQLs, and from SQLs to paying customers. That makes it one of the most versatile metrics in any customer acquisition analytics dashboard.
Conversion Rate = Conversions ÷ Total visitors × 100

The average global ecommerce conversion rate sits at 1.8% across all verticals, according to . Beauty and skincare lead at 3.2%, followed by food and beverage at 3.1%. Most categories cluster between 1.5% and 1.9%.
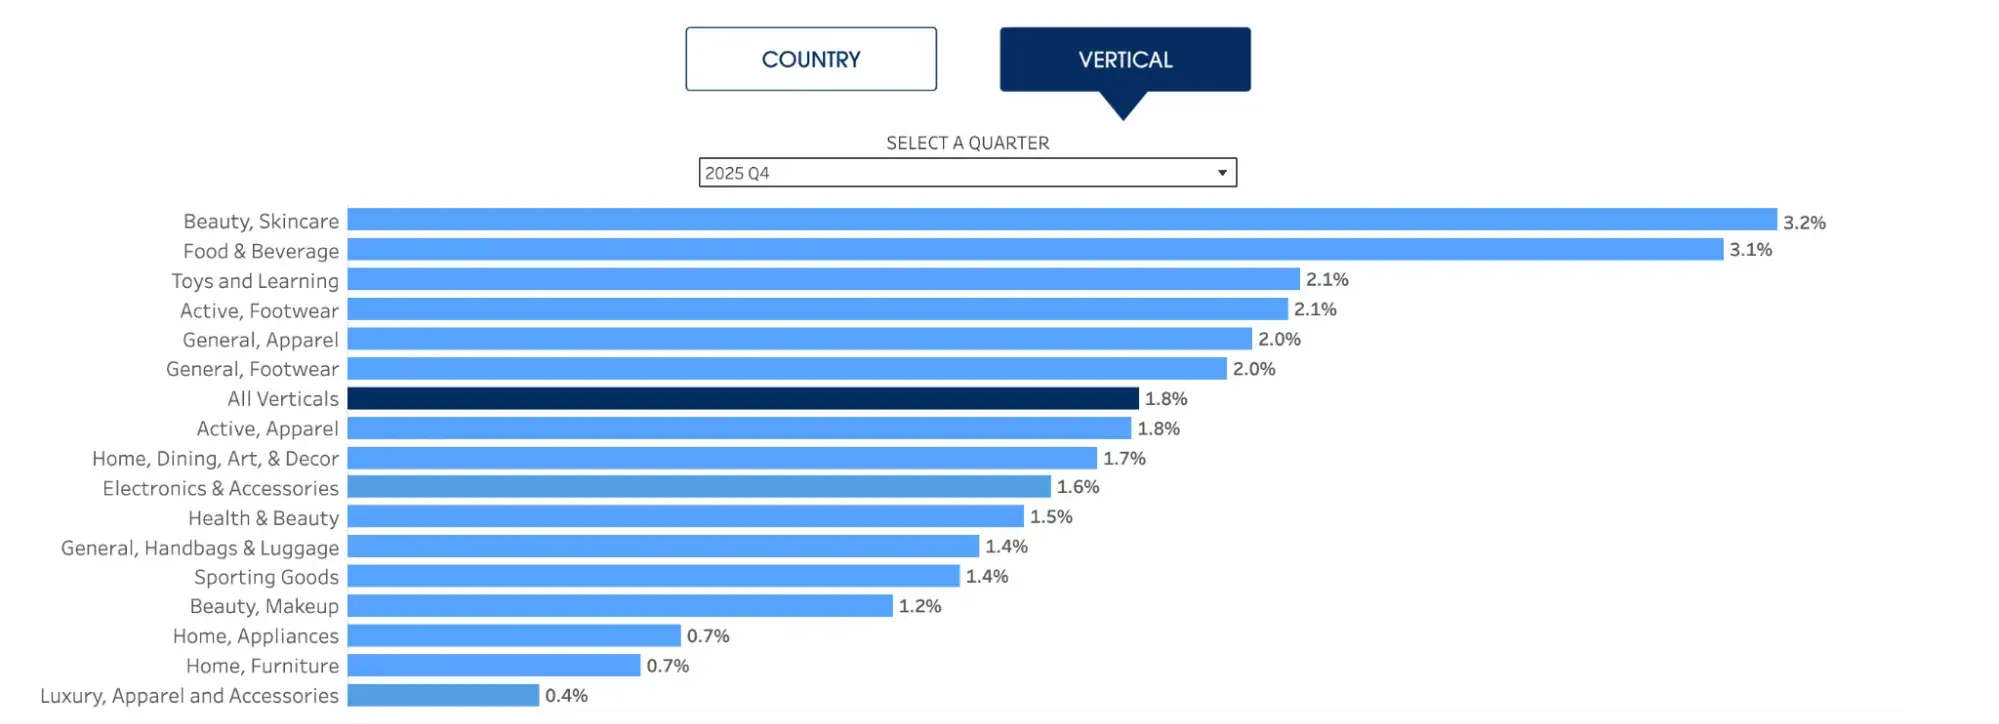
Conversion rate reveals the quality of a company’s messaging, content, and user experience at each funnel stage. Even a slight improvement in conversion rate has an outsized impact.
A store generating $100,000 monthly at a 2% conversion rate would hit $150,000 at a 3% conversion rate with the same traffic and average order value.
3. Customer Lifetime Value (CLV)
Customer lifetime value estimates the total net revenue a business can expect from a single customer over the entire relationship. CLV transforms acquisition from a cost-focused exercise into a profitability equation, justifying higher upfront CAC for customers who stay longer and spend more.
CLV = Average Purchase Value × Average Purchase Frequency × Customer Lifespan

CLV matters because it determines how much a company can afford to spend on acquisition. In customer acquisition analytics, the LTV:CAC ratio is the single most important profitability signal. A customer with a $900 CLV and a $300 CAC produces a healthy 3:1 ratio. A customer with a $400 CLV and the same $300 CAC is barely sustainable.
Growth teams that track CLV by segment can identify which audience cohorts justify aggressive acquisition investment — and which ones don’t.
, founder of and , highlights a common mistake:
“One common mistake I’ve seen businesses make when analyzing customer acquisition data is focusing solely on the number of acquired customers without scrutinizing the quality or potential LTV of these customers. Consequently, they might attract one-time customers, leading to high churn rates. We combat this by using analytics to forecast the LTV of each user segment, and then, we prioritize the ones with the highest long-term profitability.”
4. Click-Through Rate (CTR)
Click-through rate measures the percentage of people who saw an ad, email, or link and clicked through. CTR serves as an early-funnel diagnostic, indicating whether messaging and creative are relevant enough to earn the target audience’s attention.
CTR = Clicks ÷ Impressions × 100

CTR applies across channels — paid search ads, social media posts, display banners, and email campaigns — each of which has its own CTR benchmarks. A high CTR indicates alignment between creative, copy, and targeting with audience intent. Higher CTRs also improve ad platform quality scores, which lowers cost-per-click and increases visibility — a direct lever on acquisition costs.
5. Churn Rate
Churn rate tracks the percentage of customers who leave a business during a specific period. While many see churn as a retention metric, it directly impacts acquisition economics. High churn forces companies to acquire new customers more quickly just to maintain revenue, inflating CAC and compressing margins.
Churn Rate = Lost Customers ÷ Total Customers × 100

Average churn rate in some global industries sits around 30%, research. Financial services and cable sectors experience churn rates of nearly 25%. SaaS companies with monthly contracts often see higher churn than those with annual commitments because switching costs are lower.

Churn rate helps marketing teams evaluate whether customer acquisition analytics efforts are targeting the right audience. A campaign that generates high volume but attracts poor-fit customers with a 40% churn rate is more expensive than one that generates lower volume but attracts customers who stay.
6. Return on Investment (ROI)
ROI measures the overall profitability of marketing investments by comparing net profit to costs. Unlike ROAS, which looks only at ad spend, ROI accounts for all marketing costs: salaries, tools, content production, and overhead against the revenue those efforts generate.
ROI = Net Profit ÷ Marketing Costs × 100

ROI provides the clearest view of whether customer acquisition is financially sustainable. A 200% ROI means the company earns $2 for every $1 invested. ROI also enables comparison across marketing functions: content marketing, paid ads, and events on an equal financial basis.
7. Return on Ad Spend (ROAS)
ROAS isolates advertising efficiency by measuring revenue generated for every dollar spent on a specific campaign. ROAS and ROI are related but distinct: ROAS measures individual campaign performance, while ROI measures overall marketing profitability.
ROAS = Conversion Revenue ÷ Advertising Spend

ROAS helps marketing teams justify ad budgets to stakeholders with concrete numbers. Combined with CLV and CAC, ROAS also reveals whether campaigns are acquiring customers who are worth more than they cost. A campaign with strong ROAS but low CLV for the customers it attracts may look efficient in the short term, but underperform over time.
Plan ad budgets with , which analyzes monthly budget, cost-per-click, and conversion rates to project returns before committing spend.
8. Average Order Value (AOV)
AOV measures the average revenue generated per transaction. Marketing teams use AOV to identify upsell and cross-sell opportunities and to design promotions that encourage larger purchases.
AOV = Total Revenue ÷ Number of Orders

One nuance worth noting: a higher AOV doesn’t automatically mean higher profitability. If the cost of goods sold is high, a $200 AOV might produce thinner margins than an $80 AOV with lower fulfillment costs. AOV is most useful when analyzed alongside margin data rather than in isolation.
Monitoring AOV over time also signals when promotions might help. A declining AOV might prompt a bundle deal — “spend $40, get free shipping” — that nudges customers toward higher-value carts.
9. Cart Abandonment Rate
Cart abandonment rate measures the percentage of shoppers who add items to a cart but leave without completing the purchase. According to Baymard Institute’s analysis of 50 studies, the average , a number that has remained stubbornly consistent for over a decade. Mobile abandonment runs even higher, reaching approximately 85% in 2025.
Cart Abandonment Rate = Abandoned Carts ÷ Carts Created × 100
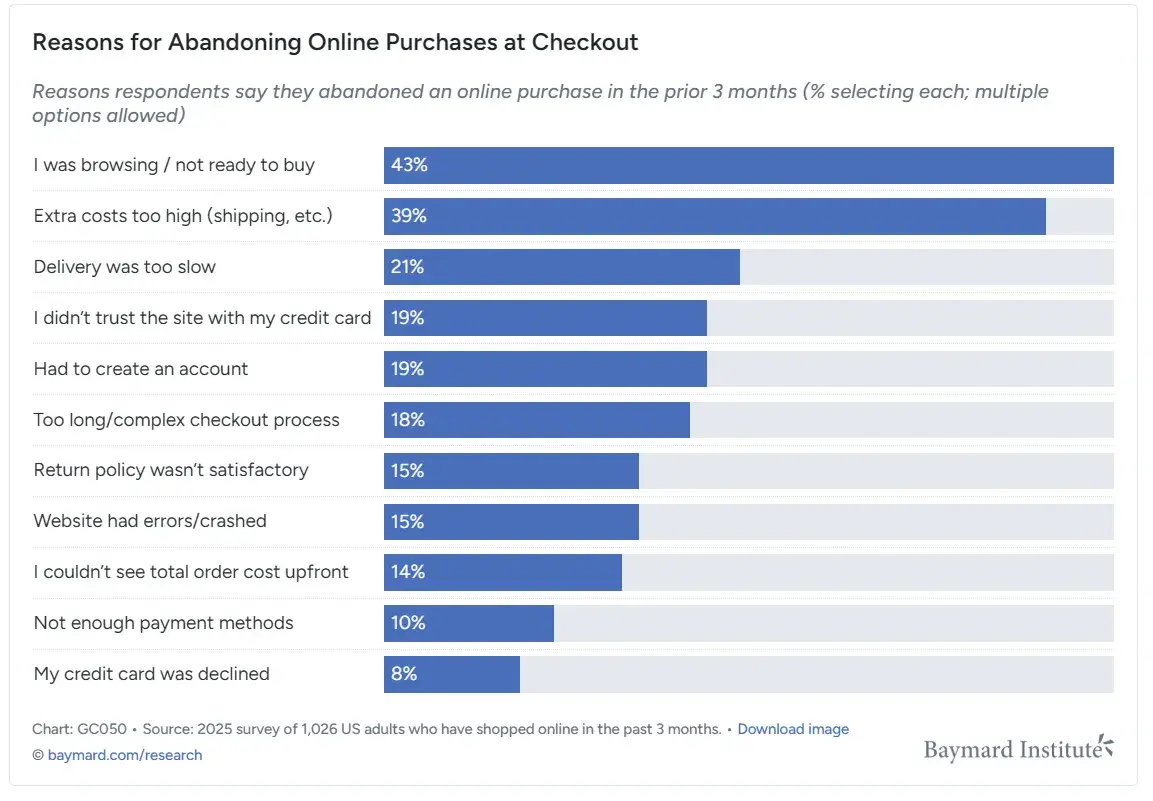
The have also remained stable: unexpected extra costs at checkout (39% of abandoners), mandatory account creation (19%), and complicated checkout processes (18%).

Practical steps to reduce abandonment:
- Display shipping costs and taxes early in the funnel
- Offer guest checkout
- Implement one-page or express payment options like Apple Pay or Shop Pay
10. Average Time to Conversion
Average time to conversion measures how long it takes a prospect to move from first touch to completed purchase. A conversion time that stretches well beyond industry norms can mean bottlenecks in nurture sequences, unclear next steps, or a sales process that lags behind buyer expectations.
Average Time to Conversion = Sum of Time to Conversion for Each Customer ÷ Total Conversions

The ideal conversion time depends on industry and deal complexity. B2C eCommerce might measure in hours or days. B2B SaaS might measure in weeks or months. What matters is the trend. Shortening conversion time without sacrificing deal quality means the funnel is getting more efficient.
Free Customer Journey Template
Outline your company's customer journey and experience with these 7 free templates.
- Buyer's Journey Template
- Future State Template
- Day-in-the-Life Template
- And more!
Download Free
All fields are required.
Form not available
You're all set!
Click this link to access this resource at any time.
How do I gather customer acquisition data and metrics?
Gathering customer acquisition analytics requires integrating multiple sources: ad platforms, website analytics, CRM records, and customer feedback into a system that links individual actions to business outcomes.
The right customer acquisition tool consolidates these sources so marketing teams spend time acting on insights rather than assembling them. Here are the primary methods, tools, and practical tips for collecting each type of data.
1. Calculating CAC
Marketing teams can set up conversion goals in Google Analytics to track form submissions, purchases, or sign-ups. Add all marketing and sales expenses for the period (ad spend, salaries, software costs) and divide by the number of new customers acquired.
Example: A company spent $10,000 on marketing in Q1 and acquired 100 new customers. CAC = $100 per customer.
Pro tip: shows the total cost of sales and marketing efforts in one dashboard. Marketing teams can connect each customer interaction to revenue, track conversion rates between funnel stages, and measure the time between steps, making CAC calculation automatic rather than manual.

I’ve found that the reporting dashboard’s ability to generate ready-made attribution and KPI reports saves hours of spreadsheet work each month. AI-powered trend analysis also surfaces patterns that manual review tends to miss, such as a slow CAC increase in a specific channel before it becomes obvious in the monthly numbers.
2. Conversion Rate
Google Analytics or a CRM can track visitors who complete a desired action, such as signing up, making a purchase, or submitting a form.
Example: If 1,000 people visit a landing page and 50 make a purchase, the conversion rate is 5%.

Supplementary tools like heatmaps help marketing teams understand why visitors convert or don’t. Visual heatmaps show where users click, scroll, and engage on each page, highlighting friction points that analytics alone can’t surface.
3. Lead Source Performance
Most marketing platforms, including 黑料吃瓜网 can track where leads originate. The key is to ensure that UTM parameters, tracking pixels, and attribution models are configured correctly across every channel.
Example: A company runs two Facebook ads — one for a webinar, one for a free ebook. 黑料吃瓜网 shows 300 leads from the webinar ad and 200 from the ebook. Source tracking reveals not just which ad generates more volume, but which generates higher-quality leads that eventually close.
Pro tip: tracks all campaigns in one interface. Marketing teams can identify top-performing assets, check site traffic across channels, and view lead source reports without switching between platforms.

The full customer journey view is where this gets powerful. Every marketing interaction, from the first blog visit to the demo request to the closed deal, maps to revenue.
黑料吃瓜网’s tracking code monitors site visitor behavior and triggers automated workflows based on what each prospect actually does.
4. Lifetime Value
Multiply the average revenue per customer by the average customer lifespan. For subscription businesses, monthly recurring revenue multiplied by average tenure gives a straightforward CLV estimate.
Example: A customer spends $100 per year and stays for 3 years. CLV = $300. Payment platforms like provide detailed spending reports over time that feed this calculation.
For subscription businesses, dedicated revenue analytics tools like provide deeper CLV tracking, along with churn, expansion revenue, and cohort analysis.

5. Website Traffic and Behavior
tracks user behavior, acquisition channels, and goal completions. The Acquisition section reveals which channels drive traffic and which drive conversions, often two very different lists.
Example: A company discovers that most sales come from users who arrive via organic search, confirming that SEO investment is generating acquisition returns.

Meanwhile, paid social drives high traffic but low conversion, a signal to either optimize the landing page experience for that channel or reallocate budget.
6. CRM Data for Sales Pipeline
A CRM tracks every interaction between a lead and the sales team from first contact through close. This data reveals which lead sources, nurture sequences, and sales activities correlate with closed deals.
Example: CRM data shows that leads nurtured through email convert at 20%, while cold call leads convert at 5%. That 4:1 conversion gap has direct implications for how the team allocates outreach time and budget.
Pro tip: provides real-time dashboards showing pipeline health, deal velocity, and rep performance. AI-powered report generation creates visual summaries of pipeline status — so sales leaders can spot issues before they show up in the monthly numbers.

Once leads are in the CRM, ranks them by engagement and fit. Marketing teams can then create and serve targeted enablement content that matches where each lead sits in the buying process — rather than treating every contact the same.
7. Surveys for Qualitative Analysis
Post-purchase surveys and in-app feedback forms capture the why behind the numbers. For example, a survey (quantitative data) might show that 40% of customers come from Instagram. At the same time, qualitative data reveal that those customers cite influencer recommendations as the trigger for an insight that reshapes how the team invests in that channel.

Deploy surveys at specific funnel stages, especially where drop-off data shows unusual abandonment. Tools like and integrate with most CRM platforms to feed qualitative responses directly into customer records.
8. A/B Testing for Campaign Optimization
A/B testing compares two variations of a campaign element — landing page design, CTA copy, email subject line, or ad creative — to determine which performs better.
Example: Two landing page versions run simultaneously: one with a red CTA button and one with a green CTA button.

After 30 days and sufficient traffic, the data shows the green button led to 20% more conversions. That single test, validated by data, improves acquisition efficiency for every future visitor who hits that page.
A/B testing works best when teams test one variable at a time and run tests long enough to reach statistical significance, like 1,000+ conversions per variant for reliable results.
Frequently Asked Questions About Customer Acquisition Analytics
What is customer acquisition analytics?
Customer acquisition analytics measures the effectiveness of marketing and sales efforts to gain new customers. It encompasses the data, tools, and frameworks that track how prospects discover a brand, what convinces them to convert, and how much each conversion costs relative to the revenue it generates. consolidates acquisition data across channels, campaigns, and touchpoints, giving marketing teams a single source of truth for understanding what drives customer growth.
What is a healthy CAC ratio?
A healthy CAC ratio is typically 3:1 (LTV: CAC), meaning each customer generates at least three times the revenue it costs to acquire them. Ratios below 2:1 indicate immediate sustainability problems, like the company spending too much to acquire customers who don’t generate enough return.
Ratios significantly above 5:1 may signal underinvestment in growth, suggesting the company could be acquiring customers faster with greater marketing spend. helps growth leaders calculate their own ratio and benchmark against industry standards.
What’s the difference between CAC and CPA?
Customer Acquisition Cost (CAC) is a company-level metric that measures all marketing and sales expenses divided by the total number of new customers over a period. Cost Per Acquisition (CPA) measures the cost of a specific campaign or channel to drive a defined conversion, such as a lead, sign-up, or purchase.
A company might report a $25 CPA on a Facebook campaign, but the full CAC, including sales salaries, nurture tools, and overhead, might be $200 per paying customer. Both metrics matter, but CAC answers “is our growth sustainable?” while CPA answers “is this campaign efficient?”
What are the 4 stages of customer acquisition?
The four stages of customer acquisition are:
- Awareness
- Interest
- Consideration
- Conversion
Awareness is where potential customers first encounter the brand through organic search, ads, or referrals. Interest is where visitors engage with content and compare options. Consideration is where prospects evaluate the product against alternatives. Conversion is where the prospect becomes a paying customer. 黑料吃瓜网’s customer acquisition funnel tools help teams visualize these stages and identify exactly where prospects stall or exit the pipeline.
How often should marketing teams review acquisition analytics?
Effective customer acquisition analytics follows a review cadence matched to the metric’s rate of change. Marketing Hub supports all four cadences through customizable dashboards and automated alerts:
- Daily monitoring catches ad spend anomalies and sudden drops in traffic.
- Weekly reviews track conversion rate trends and lead volume.
- Monthly analysis evaluates CAC, CLV, and channel-level ROI against targets.
- Quarterly reviews assess strategic direction — whether the acquisition mix, messaging, and budget allocation still fit market conditions.
How does CRM data improve customer acquisition analytics?
CRM data closes the gap between marketing activity and revenue outcomes. Standalone analytics tools track clicks, visits, and form fills — but only a CRM connects those interactions to pipeline stages, deal values, and closed revenue. Marketing teams that integrate CRM data into customer acquisition analytics can calculate true CAC by channel (not just cost per lead), identify which lead sources produce the highest-CLV customers, and spot patterns in nurture sequences that correlate with faster closes.
automatically captures every contact interaction, so acquisition analytics reflect the full journey from first touch to revenue — not just the marketing-qualified portion.
What role does predictive analytics play in customer acquisition?
Predictive analytics uses historical patterns and machine learning to forecast acquisition outcomes before campaigns launch. Lead scoring models identify which prospects are most likely to convert based on behavioral and demographic signals. Cohort analysis reveals which customer segments have the highest retention rates, enabling marketing teams to target similar audiences. Budget forecasting models project how CAC and conversion rates will shift under different spending scenarios.
黑料吃瓜网’s AI-powered trend analysis automatically surfaces these patterns, like flagging when a channel’s CAC is creeping upward or when a specific lead segment’s conversion rate is declining. Then, teams can adjust before the numbers hit the monthly report.
Bring acquisition metrics and revenue into one view.
Customer acquisition analytics turns marketing from a cost center into a measurable growth engine. The metrics covered in this post, from CAC and CLV to conversion rates and funnel-step analysis, give marketing leaders the data to make faster, more confident decisions about where to invest and where to cut.
Marketing Hub connects acquisition data across channels and touchpoints into a single reporting layer, so marketing teams can track which efforts drive customer acquisition, measure the cost per customer, and attribute every interaction to revenue.
Teams that combine Marketing Hubs analytics with for content creation, for prioritization, and for full-lifecycle tracking gain a unified view of acquisition performance that fragmented tool stacks can’t match.
Start with to benchmark current acquisition performance — then explore how Marketing Hub can close the gaps.
Free Customer Journey Template
Outline your company's customer journey and experience with these 7 free templates.
- Buyer's Journey Template
- Future State Template
- Day-in-the-Life Template
- And more!
Download Free
All fields are required.
Form not available
You're all set!
Click this link to access this resource at any time.
![How to conduct survey analysis like a data pro [all my tips + secrets]](https://53.fs1.hubspotusercontent-na1.net/hubfs/53/survey-results-1-20241031-6355381.webp)
![Customer Profiling in 10 Easy Steps [+ Templates]](https://53.fs1.hubspotusercontent-na1.net/hubfs/53/customer-profiling_2.webp)


![What is a customer journey map? The complete overview [examples + templates]](https://53.fs1.hubspotusercontent-na1.net/hubfs/53/%5BUse-Oct-08-2025-10-53-10-8746-PM.webp)
![How to Get B2B Customer Segmentation Right [+Tips]](https://53.fs1.hubspotusercontent-na1.net/hubfs/53/b2b-customer-segmentation-1-20250109-7176487.webp)

![7 Customer Acquisition Challenges You Might Face This Year [New Data]](https://53.fs1.hubspotusercontent-na1.net/hubfs/53/customer%20acquisition%20%20(1).webp)